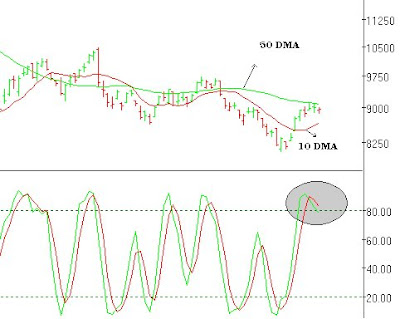
Sensex daily Chart
As we had mentioned in the last week report it was a good week for the Indian market that rallied substantially. Sensex and Nifty gained 2.4% and 3.2% or 210 and 88 points respectively. As we see in below chart Sensex tested its resistance of 50 DMA from last three days but unable break the resistance and also closed below 9000.
For the coming week we are expecting the negative trend until it beaks and closes above 50 DMA and also as we see in the Sensex chart below, momentum indicators are in over bought zone. Sensex is expected to go down up to 8650 which is near to its 10 DMA, below this we can see once again 8000 level in Coming days. At upside If Sensex closes above the 50 DMA we can see the movement up to 9450.
For the coming week, the Sensex resistance and Support will be at 9120 & 9450 and 8550 & 8000 respectively.

No comments:
Post a Comment